Search for Indicators

COVID-19
COVID-19 Vulnerable Populations
Click here for COVID-19 Impact Response Fund information
COVID-19
Locating At-Risk Populations
Find Vulnerable Communities for Future Action
See each county’s risk for severe illness burden due to COVID-19 based on trends in reported COVID-19 cases and deaths, clinical risk factors, and social and economic determinants. Updated every day. Learn More
See data and mapping at the county, ZIP code, and census tract level for populations at risk of not having their basic needs met due to stay-at-home orders:
Indicator Gauge Icon Legend
Legend Colors
Red is bad, green is good, blue is not statistically different/neutral.
Compared to Distribution
 the value is in the best half of communities.
 the value is in the 2nd worst quarter of communities.
 the value is in the worst quarter of communities.
Compared to Target
 meets target;
  does not meet target.
Compared to a Single Value
 lower than the comparison value;
 higher than the comparison value;
 not statistically different from comparison value.
Trend

 non-significant change over time;
 significant change over time;
  no change over time.
Compared to Prior Value
 higher than the previous measurement period;
 lower than the previous measurement period;
 no statistically different change from previous measurement period.
County: Abbeville
COVID-19 Cases
Value
Compared to:
County: Abbeville COVID-19 Daily Average Incidence Rate
County: Abbeville COVID-19 Daily Average Incidence Rate
6.52
Cases per 100,000 population
(Mar 3, 2023)
Compared to:


SC Counties
The distribution is based on data from 46 South Carolina counties.
U.S. Counties
The distribution is based on data from 3,142 U.S. counties and county equivalents.
SC Value
(12.27)
The regional value is compared to the South Carolina State value.
US Value
(10.97)
The regional value is compared to the national value.
Prior Value
(9.48)
Prior Value compares a measured value with the previously measured value. Confidence intervals were not taken into account in determining the direction of the comparison.
Trend
This comparison measures the indicator’s values over multiple time periods.<br>The Mann-Kendall Test for Statistical Significance is used to evaluate the trend<br>over 4 to 10 periods of measure, subject to data availability and comparability.
County: Abbeville COVID-19 Daily Average Case-Fatality Rate
County: Abbeville COVID-19 Daily Average Case-Fatality Rate
0.0
Deaths per 100 cases
(Mar 3, 2023)
Compared to:
SC Counties
(Feb 24, 2023)
The distribution is based on data from 46 South Carolina counties.
U.S. Counties
(Mar 25, 2022)
The distribution is based on data from 2,811 U.S. counties and county equivalents.
SC Value
(3.1)
The regional value is compared to the South Carolina State value.
US Value
(1.7)
The regional value is compared to the national value.
Prior Value
(0.0)
Prior Value compares a measured value with the previously measured value. Confidence intervals were not taken into account in determining the direction of the comparison.
Trend
This comparison measures the indicator’s values over multiple time periods.<br>The Mann-Kendall Test for Statistical Significance is used to evaluate the trend<br>over 4 to 10 periods of measure, subject to data availability and comparability.
County: Abbeville
Vulnerable or High-Need Populations
Value
Compared to:
County: Abbeville Population Over Age 65 (Count)
County: Abbeville Population Over Age 65 (Count)
5,397
People
(2018-2022)
Compared to:

Trend
This comparison measures the indicator’s values over multiple time periods.<br>The Mann-Kendall Test for Statistical Significance is used to evaluate the trend<br>over 4 to 10 periods of measure, subject to data availability and comparability.
County: Abbeville People 65+ Living Alone (Count)
County: Abbeville People 65+ Living Alone (Count)
1,486
People
(2018-2022)
Compared to:

Trend
This comparison measures the indicator’s values over multiple time periods.<br>The Mann-Kendall Test for Statistical Significance is used to evaluate the trend<br>over 4 to 10 periods of measure, subject to data availability and comparability.
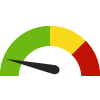
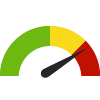
County: Abbeville People 65+ Living Alone
County: Abbeville People 65+ Living Alone
27.5%
(2018-2022)
Compared to:

SC Counties
The distribution is based on data from 46 South Carolina counties.
U.S. Counties
The distribution is based on data from 3,133 U.S. counties and county equivalents.
SC Value
(25.7%)
The regional value is compared to the South Carolina State value.
US Value
(26.4%)
The regional value is compared to the national value.
Trend
This comparison measures the indicator’s values over multiple time periods.<br>The Mann-Kendall Test for Statistical Significance is used to evaluate the trend<br>over 4 to 10 periods of measure, subject to data availability and comparability.
County: Abbeville People 65+ Living Below Poverty Level (Count)
County: Abbeville People 65+ Living Below Poverty Level (Count)
681
People
(2018-2022)
Compared to:
Trend
This comparison measures the indicator’s values over multiple time periods.<br>The Mann-Kendall Test for Statistical Significance is used to evaluate the trend<br>over 4 to 10 periods of measure, subject to data availability and comparability.
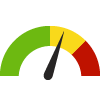
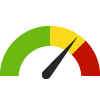
County: Abbeville People 65+ Living Below Poverty Level
County: Abbeville People 65+ Living Below Poverty Level
12.9%
(2018-2022)
Compared to:
SC Counties
The distribution is based on data from 46 South Carolina counties.
U.S. Counties
The distribution is based on data from 3,133 U.S. counties and county equivalents.
SC Value
(10.3%)
The regional value is compared to the South Carolina State value.
US Value
(10.0%)
The regional value is compared to the national value.
Trend
This comparison measures the indicator’s values over multiple time periods.<br>The Mann-Kendall Test for Statistical Significance is used to evaluate the trend<br>over 4 to 10 periods of measure, subject to data availability and comparability.
County: Abbeville Households Receiving SNAP with Children (Count)
County: Abbeville Households Receiving SNAP with Children (Count)
603
Households
(2018-2022)
Compared to:

Trend
This comparison measures the indicator’s values over multiple time periods.<br>The Mann-Kendall Test for Statistical Significance is used to evaluate the trend<br>over 4 to 10 periods of measure, subject to data availability and comparability.
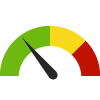
County: Abbeville Households Receiving SNAP with Children
County: Abbeville Households Receiving SNAP with Children
48.3%
(2018-2022)
Compared to:


SC Value
(51.8%)
The regional value is compared to the South Carolina State value.
US Value
(47.9%)
The regional value is compared to the national value.
Trend
This comparison measures the indicator’s values over multiple time periods.<br>The Mann-Kendall Test for Statistical Significance is used to evaluate the trend<br>over 4 to 10 periods of measure, subject to data availability and comparability.
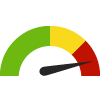
County: Abbeville Families Living Below Poverty Level
County: Abbeville Families Living Below Poverty Level
11.2%
(2018-2022)
Compared to:
SC Counties
The distribution is based on data from 46 South Carolina counties.
U.S. Counties
The distribution is based on data from 3,104 U.S. counties and county equivalents.
SC Value
(10.2%)
The regional value is compared to the South Carolina State value.
US Value
(8.8%)
The regional value is compared to the national value.
Trend
This comparison measures the indicator’s values over multiple time periods.<br>The Mann-Kendall Test for Statistical Significance is used to evaluate the trend<br>over 4 to 10 periods of measure, subject to data availability and comparability.
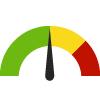
County: Abbeville Children Living Below Poverty Level
County: Abbeville Children Living Below Poverty Level
26.1%
(2018-2022)
Compared to:
SC Counties
The distribution is based on data from 46 South Carolina counties.
U.S. Counties
The distribution is based on data from 3,132 U.S. counties and county equivalents.
SC Value
(20.3%)
The regional value is compared to the South Carolina State value.
US Value
(16.7%)
The regional value is compared to the national value.
Trend
This comparison measures the indicator’s values over multiple time periods.<br>The Mann-Kendall Test for Statistical Significance is used to evaluate the trend<br>over 4 to 10 periods of measure, subject to data availability and comparability.
County: Abbeville
65+ Population with Disabilities
Value
Compared to:
County: Abbeville Adults 65+ with a Self-Care Difficulty
County: Abbeville Adults 65+ with a Self-Care Difficulty
6.1%
(2018-2022)
Compared to:

SC Value
(7.1%)
The regional value is compared to the South Carolina State value.
US Value
(7.4%)
The regional value is compared to the national value.
Trend
This comparison measures the indicator’s values over multiple time periods.<br>The Mann-Kendall Test for Statistical Significance is used to evaluate the trend<br>over 4 to 10 periods of measure, subject to data availability and comparability.
County: Abbeville Adults 65+ with an Independent Living Difficulty
County: Abbeville Adults 65+ with an Independent Living Difficulty
8.3%
(2018-2022)
Compared to:
SC Value
(13.1%)
The regional value is compared to the South Carolina State value.
US Value
(13.6%)
The regional value is compared to the national value.
Trend
This comparison measures the indicator’s values over multiple time periods.<br>The Mann-Kendall Test for Statistical Significance is used to evaluate the trend<br>over 4 to 10 periods of measure, subject to data availability and comparability.
County: Abbeville Adults 65+ with a Disability
County: Abbeville Adults 65+ with a Disability
28.0%
(2018-2022)
Compared to:
SC Value
(33.8%)
The regional value is compared to the South Carolina State value.
US Value
(33.3%)
The regional value is compared to the national value.
Trend
This comparison measures the indicator’s values over multiple time periods.<br>The Mann-Kendall Test for Statistical Significance is used to evaluate the trend<br>over 4 to 10 periods of measure, subject to data availability and comparability.
County: Abbeville Adults 65+ with a Vision Difficulty
County: Abbeville Adults 65+ with a Vision Difficulty
5.0%
(2018-2022)
Compared to:
SC Value
(6.7%)
The regional value is compared to the South Carolina State value.
US Value
(6.0%)
The regional value is compared to the national value.
Trend
This comparison measures the indicator’s values over multiple time periods.<br>The Mann-Kendall Test for Statistical Significance is used to evaluate the trend<br>over 4 to 10 periods of measure, subject to data availability and comparability.
County: Abbeville Adults 65+ with a Hearing Difficulty
County: Abbeville Adults 65+ with a Hearing Difficulty
10.9%
(2018-2022)
Compared to:
SC Value
(13.6%)
The regional value is compared to the South Carolina State value.
US Value
(13.7%)
The regional value is compared to the national value.
Trend
This comparison measures the indicator’s values over multiple time periods.<br>The Mann-Kendall Test for Statistical Significance is used to evaluate the trend<br>over 4 to 10 periods of measure, subject to data availability and comparability.
County: Abbeville
Population with Underlying Conditions
Value
Compared to:
County: Abbeville Adults 20+ with Diabetes
County: Abbeville Adults 20+ with Diabetes
9.4%
(2021)
Compared to:
SC Counties
The distribution is based on data from 46 South Carolina counties.
U.S. Counties
The distribution is based on data from 3,074 U.S. counties and county equivalents.
Prior Value
(10.3%)
Prior Value compares a measured value with the previously measured value. Confidence intervals were taken into account in determining the direction of the comparison.
Trend
This comparison measures the indicator’s values over multiple time periods.<br>The Mann-Kendall Test for Statistical Significance is used to evaluate the trend<br>over 4 to 10 periods of measure, subject to data availability and comparability.
County: Abbeville Diabetes: Medicare Population
County: Abbeville Diabetes: Medicare Population
28.0%
(2022)
Compared to:
SC Counties
The distribution is based on data from 46 South Carolina counties.
U.S. Counties
The distribution is based on data from 3,129 U.S. counties and county equivalents.
SC Value
(26.0%)
The regional value is compared to the South Carolina State value.
US Value
(24.0%)
The regional value is compared to the national value.
Prior Value
(28.0%)
Prior Value compares a measured value with the previously measured value. Confidence intervals were not taken into account in determining the direction of the comparison.
Trend
This comparison measures the indicator’s values over multiple time periods.<br>The Mann-Kendall Test for Statistical Significance is used to evaluate the trend<br>over 4 to 10 periods of measure, subject to data availability and comparability.
County: Abbeville Asthma: Medicare Population
County: Abbeville Asthma: Medicare Population
5.0%
(2022)
Compared to:

SC Counties
The distribution is based on data from 46 South Carolina counties.
U.S. Counties
The distribution is based on data from 3,129 U.S. counties and county equivalents.
SC Value
(7.0%)
The regional value is compared to the South Carolina State value.
US Value
(7.0%)
The regional value is compared to the national value.
Prior Value
(4.0%)
Prior Value compares a measured value with the previously measured value. Confidence intervals were not taken into account in determining the direction of the comparison.
Trend
This comparison measures the indicator’s values over multiple time periods.<br>The Mann-Kendall Test for Statistical Significance is used to evaluate the trend<br>over 4 to 10 periods of measure, subject to data availability and comparability.
County: Abbeville COPD: Medicare Population
County: Abbeville COPD: Medicare Population
9.0%
(2022)
Compared to:
SC Counties
The distribution is based on data from 46 South Carolina counties.
U.S. Counties
The distribution is based on data from 3,129 U.S. counties and county equivalents.
SC Value
(11.0%)
The regional value is compared to the South Carolina State value.
US Value
(11.0%)
The regional value is compared to the national value.
Prior Value
(10.0%)
Prior Value compares a measured value with the previously measured value. Confidence intervals were not taken into account in determining the direction of the comparison.
Trend
This comparison measures the indicator’s values over multiple time periods.<br>The Mann-Kendall Test for Statistical Significance is used to evaluate the trend<br>over 4 to 10 periods of measure, subject to data availability and comparability.
